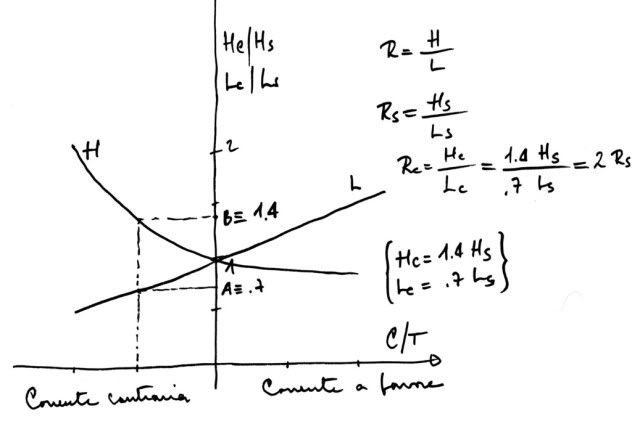
The Scripps Institution of Oceanography (IIRC) has developed this simple graph describing the modifications of wave characteristics when under the effect of a current of given speed.
The two curves called H (height) and L(length) show how these two wave characteristics are modified by a favourable current (to the right of the vertical axis), or more interestingly by an opposing current (to the left of the vertical axis.
The horizontal axis shows the ratio between current speed and wave period, the vertical axis shows: 1. Hc/Hs, ratio between wave height with current and wave height without current; 2. Lc/Ls, wave length with current and wave length without current.
"R" is a measure of wave steepness, the ratio between height and length. It is usually accepted that beyond a 1:7 steepness the wave breaks. Suppose one is sailing in a 1:10 steep wave, say 2m high, 20m long, and all of a sudden an opposing current brings us along the dashed line in the graph.
Along line L one can find Lc (point A): it's 70% of Ls. The current shortens the wave, which is now only 14m long. Along line H one can find Hc: 1.4 times Hs, the opposing current brings wave height to 2.8m. The theoretical steepness of the resulting wave would be 1:5, in practice the wave would have broken already...
Of course, real world waves are not of constant length nor height, but rather a group of relatively smaller ones, followed by a group of higher waves and so on... in practice the boat finds herself like periodically jumping in a hole in the water, usually with the loudest crash. When water depth is sufficiently low, the effect is magnified.


Nessun commento:
Posta un commento